
‹
›
‹
›
Carbon Black Microscopic Dispersion Measurement Software 2024
Operating Procedure for Carbon Black Dispersion Measurement
(一) Carbon Black Dispersion Size Grade Rating
1. Select Module:
l Click Select the module to be analyzed: (Dispersion Size Grade)

(Select the first module)

(主界面)
2.Camera Sampling:
l Click Load Image, select the Video Sampling option in the pop-up window, then click OK. The image acquisition window will appear。

l Preview: On the image acquisition window interface, click Start Preview; the video of the specimen image observed under the microscope will appear in the window. Then adjust the image sharpness by turning the microscope's focusing handwheel, and optimize the brightness of the light source and the size of the aperture diaphragm to achieve the best image effect. Finally, click Capture Image to obtain the micrograph.

l Capture: After clicking Capture Image, a prompt indicating successful capture will appear. 。Click Exit (the image just capturedwillthenappearontheinterface).
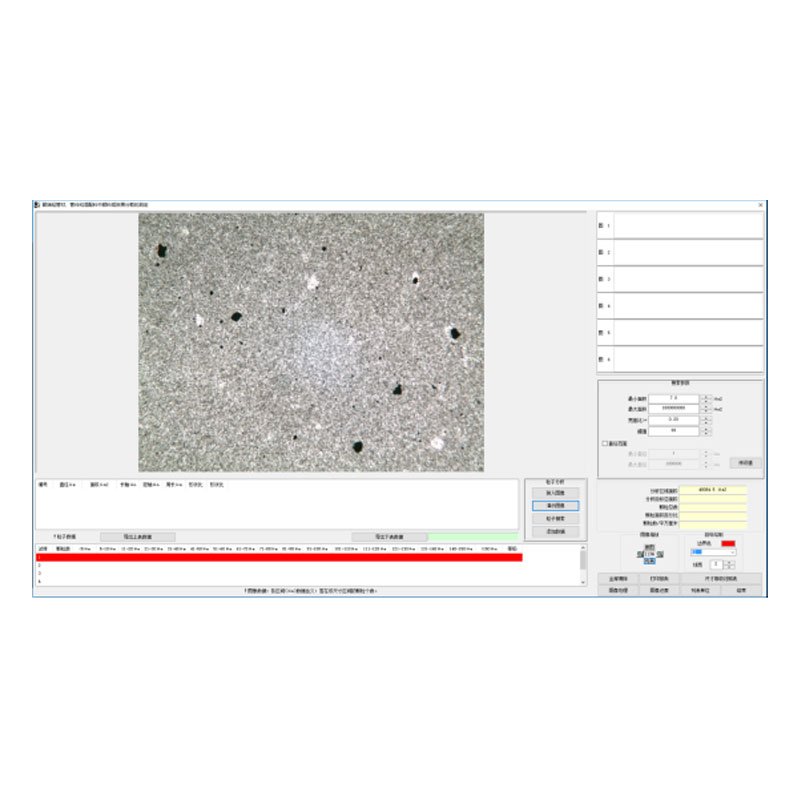
3.Particle Analysis:

l Load Image: Click this button to load images in BMP or JPG format.
l Image Processing: Click the Image Processing button to process the loaded image.
l Demo Images: Click this button to scroll and load the 3 pre-installed demo images in the software, helping users familiarize themselves with the software operation more easily.
l Particle Search: Click this button to search for particles in the image.
l Add Data: Add the number of carbon black particles within different diameter ranges identified in the search to the Particle Data list.
l Search Parameters: Adjust the values here to optimize the carbon black particle search. These parameters generally do not need to be modified once set properly.

Minimum Area, Maximum Area, Aspect Ratio, Diameter Range: The software only detects particles within the set ranges.
Threshold: Different threshold values can be set to achieve varied detection results.

(The detected particles)
After the particle search is completed, the parameters of each particle will be displayed in the particle list. If the user deems a particle to be non-compliant, they can right-click the corresponding row in the list and delete it.

If the user deems a particle non-compliant, they can right-click the corresponding row in the list and delete it.

4.View Grade:Click the Size Grade Comparison Table to check the grades specifiedinthestandard.

(二) Carbon Black Dispersion Appearance Grade Rating
1. Select Module:
l Click Then select the second analysis module (as shown in the figure below) and click OK.

l Enter the interface

(主界面)
2.Camera Sampling:
l Click Load Image, select the Video Sampling option in the pop-up window, then click OK. The image acquisition window will appear.

l On the image acquisition window interface, click Start Preview: the video of the specimen image observed under the microscope will appear in the window. Then adjust the image sharpness by turning the microscope's focusing handwheel, and optimize the brightness of the light source and the size of the aperture diaphragm to achieve the best image effect. Finally, click Capture Image to obtain the micrograph.

3. Comparison and Rating
l Set the corresponding magnification for the captured micrograph, then compare it with the standard images on the left (i.e., the images in AppendixBofGB/T18251-2019)forrating.

l After clicking to select the corresponding grade for comparison, the matching grade will be displayed.

4.Print Report:
l After the rating is completed, click Print Report to enter the print report/edit and preview interface. In the print report editing interface, you can enter and complete the relevant content of the print report (e.g., enter the unit name, test time, tester’s name, set the image magnification and scale bar, etc.). The report can also be exported and saved in three formats: PDF, WORD and EXCEL.
l In the Print Report function, users can click Print Preview to check the reporteffect.

Shandong Laishi Automation Technology Co., Ltd. (hereinafter referred to as "Laishi") is composed of a technical team with more than 10 years of research and development and manufacturing experience. The registered capital of the company is 3 million yuan. We specialize in the research and development, production, and sales of various desktop hardness testers and metallographic sampling equipment, and provide professional research and sales services for physical and chemical testing instruments, laboratory equipment, analytical equipment, and automation equipment.
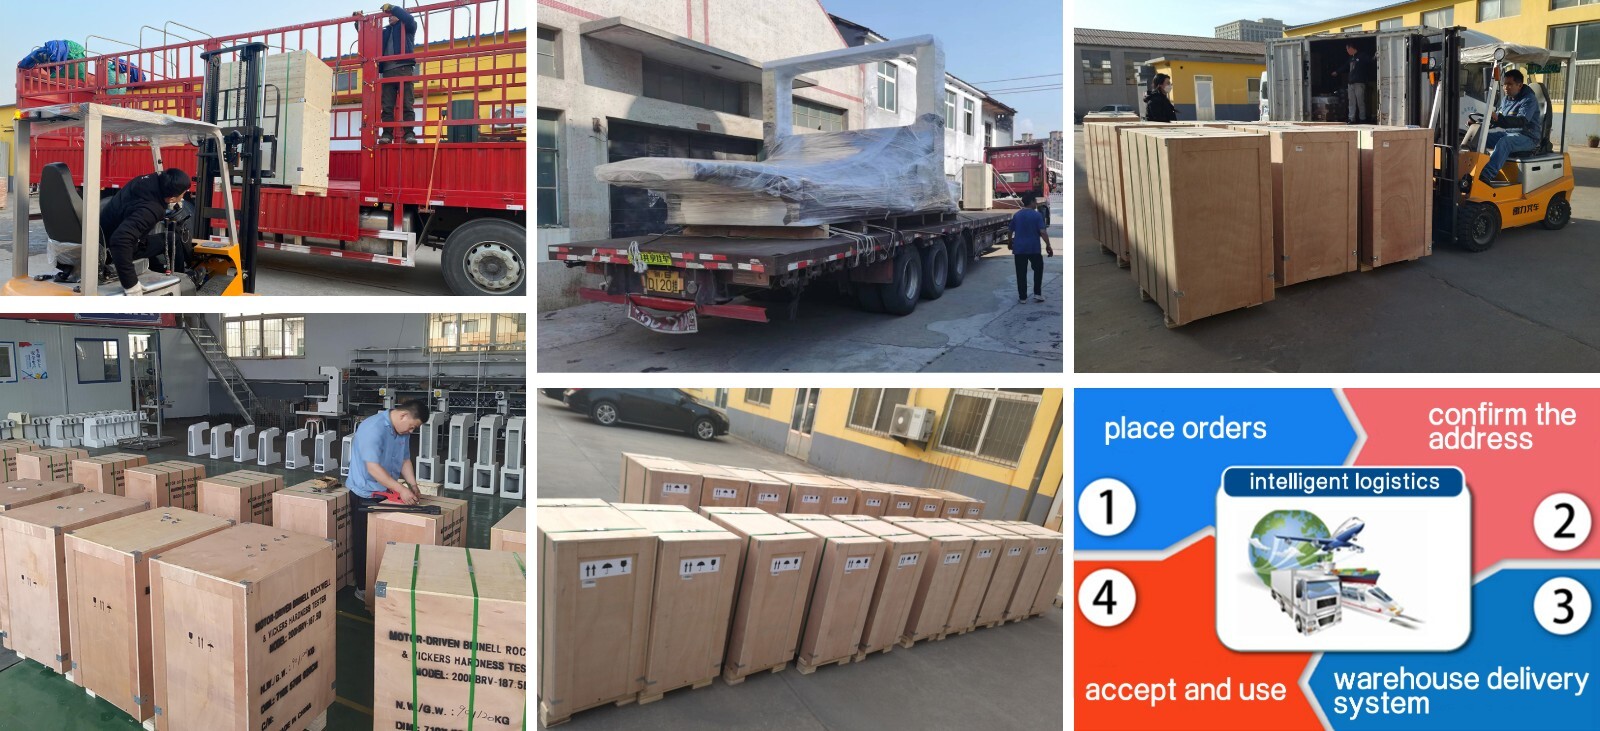
Packaging and Shipping
Have an inquiry or some feedbak for us? Fill out the form below to contact our team.
Related Product Recommendations
 Introduction to the Fiber Software SystemMore Details +
 Microscopy Software") Rock (Polarizing) Microscopy SoftwareMore Details +
Rock (Polarizing) Microscopy SoftwareMore Details + Porosity Image Analysis SystemMore Details +
 Introduction to Particle Size Image Analysis SoftwareMore Details +
 Introduction to Cleanliness Image Analysis SoftwareMore Details +
 Genuine FMIA2025 Metallographic Image Analysis SoftwareMore Details +
 FHF2024 Weld Penetration Measurement SoftwareMore Details +
 FEG Series Digital Microscope CameraMore Details +
 FCL-RS Metallographic Image Measurement SoftwareMore Details +
 Carbon Black Microscopic Dispersion Measurement Software 2024More Details +

 Microscopy Software")


Search Starts Here
Our Email