
‹
›
‹
›
Introduction to the Fiber Software System
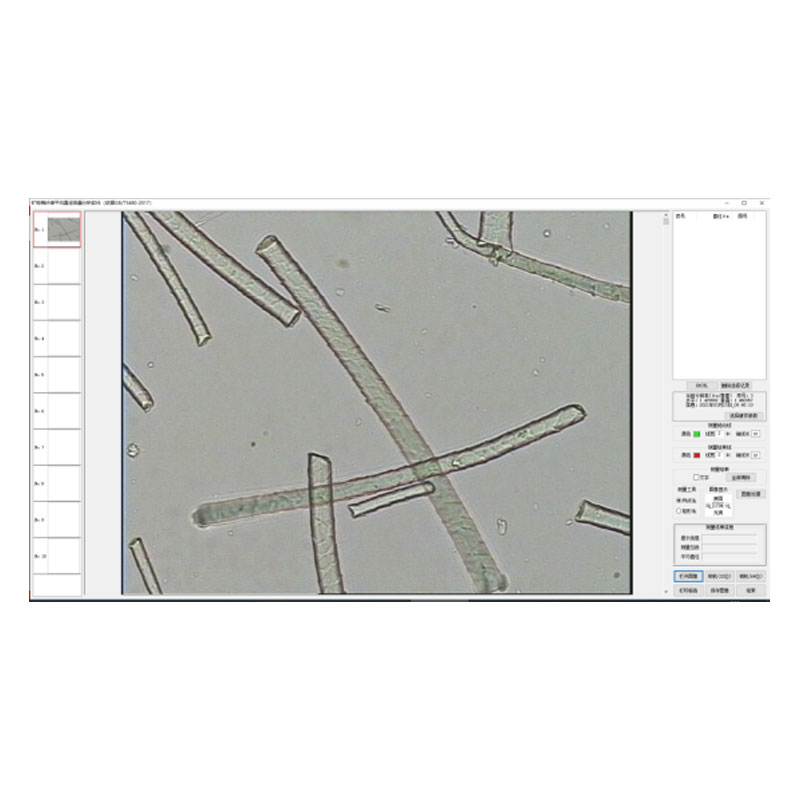
一、 Measurement and Analysis of Average Diameter of Mineral Wool Fibers
1. Select Module:
Ø Click Then select the Analysis Module.

Ø Enter the interface

(Main Interface)
2、Measurement Data
Ø First, open the interface and import the image to be measured.
 You can select the image to be measured from the navigation bar.

(The interface after importing the image)
Ø The measurement tools available are Rectangle Method and Two-Point Method.
Ø First select the Two-Point Method for measurement → hold down the mouse and drag to draw a line segment
Ø Check the box for Text — the measurement text will be displayed on the image interface.

Ø Set the color and size of the dragged line segment.

Ø(Drag the measurement line to set its color, line width and end line length.)

Ø(Show the measurement line, and set the color, line width and end line length.)

(Measurement Interface)
Ø The measurement data will be automatically output and sorted on the right side.

Ø The available measurement tools are Rectangle Method and Two-Point Method.
Ø Select the Rectangle Method for measurement → drag directly to draw a rectangular box.

(Measurement Interface)
Ø The data will be automatically accumulated.

3、Print Report:
Ø Print Report Users can click Print Preview to view the report effect.


Ø Information such as the report name can be entered manually.

Ø Files can be saved in multiple formats.
二、 Fiber Image Measurement for Asphalt Pavement
1、Select Module:
Ø Click and select the analysis module.

Ø Enter the interface.

Ø  Open the image and import the picture to be measured.
 You can select the image to be measured from the navigation bar.

(The interface after importing the image.)
Ø The measurementtoolsinclude "Experimental Method for Fiber Length and Diameter" and "Experimental Method for Determining Fiber Diameter by Cross-Section Method".

(1)Experimental Method for Fiber Length and Diameter
Ø First, select "Experimental Method for Fiber Length and Diameter" for measurement —> directly hold down the mouse and drag a line segment.
Ø Themeasurementtypesinclud "Two-point Method" and "Polyline Method".
Ø There are two measurement types: length and diameter.
Ø Check the box for Text — the measurement text will be displayed on the image interface.
Ø Set the color and size of the dragged line segment.

Drag line and measurement line (display measurement, set color, line width, end line length).

(Measurement interface)
Ø The measurement data will be automatically output and sorted on the right side.

Ø The measurement types include "Two-point Method" and "Line Selection Method".
Ø Select "Line Selection Method" for measurement —> First, left-click on the interface to confirm the starting point, left-click sequentially to confirm the next points, and finally double-left-click to complete the measurement.

(Measurement interface)
Ø The data will be accumulated automatically.

(2)Experimental Method for Fiber Length and Diameter
Ø Then select "Experimental Method for Determining Fiber Diameter by Cross-Section Method" for measurement.

Ø Check the Text option — the measurement text will be displayed on the image.
Ø Set the color and size of the dragged line segment.

Drag line and measurement line (display measurements, set color, line width, and end line length).
Ø Select measurement standard

Ø Appendix G: Select the measurement standard as required.

Ø Hold down the left mouse button and draw a circle to enclose the fiber.

(Measurement interface)
Ø Appendix T: Select the measurement standard as required.


Ø The measurement data will be automatically output and sorted on the right side.

Ø The measurement data will be automatically output and sorted on the right side.

2、Print Report
Ø  Click the button on the interface.


Ø Information such as the report name can be entered manually.

Ø Files can be saved in multiple formats.
3、Scale Setup
Ø Click the Scale Setup button.

Ø Set the corresponding scale items.

Ø Display the ruler effect:

三、 Fiber Analysis
1、Select Module:
Ø Click and select the analysis module.

Ø Enter the interface.

2、Parameter Value Correction
Ø Click the Parameter Settings button.

Ø The left list displays measurement parameters, and the category list shows test sample lists. The default parameters are shown in the figure. Double-click any row in the list to modify it.


Ø You can add samples, adjust the number of groups, coefficients and intervals globally, and restore the factory settings.Click the OK button to return to the measurement interface after configuration.
3、Measurement
ØSelect the measuring tool, and you can directly drag on the interface to measure fiber diameter.


Ø The "Boundary Adjustment" at the bottom right of the interface is specially used for rectangular measurement. It is used to set the gray value for judging the fiber boundary, so as to locate the fiber boundary more accurately and calculate the fiber diameter more precisely.
Ø Select the measurement type and sample type.

Ø Double-click a row in the measurement list to modify the fiber name and category.

Ø Right-click a row in the list to modify the fiber measurement data.

4、Test Sample
Ø Click the Test New Sample button before testing.

Ø Enter the corresponding data and click Save as shown in the figure.
5、Statistical Chart
Ø Click the Statistical Chart button.

Ø The upper figure shows the distribution of particles in each group distance of fibers, and the lower figure shows the average diameter distribution of measured fibers. The group distance can be adjusted, and the curve can be zoomed with the mouse.
Ø Export and print the curve chart as shown in the figure.

6、Measurement Report
Ø Click the Measurement Report button on the interface.

Ø Information such as the report name can be entered manually.

Ø Files can be saved in multiple formats.
7、Save Measurement Results
Ø The software can save the measurement data results. Click the Save Measurement Results button.


Ø Click Save.
8、Open Measurement Results
Ø To open and view the saved data, click the Open Measurement Results button.

Ø Select the file to open and click Open to load the previously saved measurement data.

四、Porosity and Asbestos Content Analysis
1、Select Module:
Ø Click and select the analysis module.

Ø Enter the interface – the interface after loading the image.

2、 Color Extraction
Move the mouse over the image on the left. A color picker tool will appear. Click directly on the color to select it.

The color information will be displayed in the middle (up to 6 colors can be extracted).

Ø The save button here can be used to save the extracted colors.
The load button can import the saved colors.


After color extraction, click the Extract Color Gamut button to start.


Then ---- Remove Noise ---- Spatial Repair ---- Color Restoration ----. (Image after processing)

3、Data Analysis
Ø Set the threshold, then click Particle Analysis.

Ø The data will be displayed in the text box on the left.

Ø Add calculation for void content (the asbestos content function is similar).

Ø Enter the content and click Add to automatically calculate the percentage.

2、 Print Report
Ø After the analysis is completed, click the Print Report button.
Ø Enter the corresponding data.

Ø Multiple report printing formats are available.

五、Determination of Mesophase Content—Point Counting—Grid Method (GB/T 38396-2019)
Ø Click and select the analysis module:

Ø Enter the interface – Interface after loading the image

Ø Set up the test grid:

Ø Left-click to add the number of mesophases, right-click to delete the number of mesophases.

Ø Click the Excel button to export the result list to an Excel file.

六、Determination of Mesophase Content—Point Counting—Grid Method (GB/T 38396-2019)
Ø Click and select the analysis module:

Ø Enter the interface – Interface after loading the image

Ø Use the left mouse button to click on the mesophase color structure to be extracted from the analysis image on the left.

Ø Check the settings and configure the parameters for mesophase extraction.

Ø Click the Calculate button to calculate the mesophase content.


Ø Use the left mouse button to delete or add mesophase structures in the analysis image on the right.


Ø Click Print Report to generate the result report.

七、Determination of Mesophase Content — Area Percentage — Check Method (GB/T 38396-2019)
Ø Click  and select the Analysis module:

Ø Enter the interface – Interface after loading the image

Ø Set the object to be checked:

Ø Check the mesophase structure in the analysis image:

Ø The system automatically calculates the mesophase content result.

Ø Click the Print Report button to generate the result report.

八、Test Method for Void Content and Fiber Volume Content of Carbon Fiber Reinforced Plastics: GB/T 3365-2008
Click  and select the Analysis module.

Enter the interface – Interface after image loading

Color Extraction
Move the mouse to the image on the left. A color picker tool will appear. Click directly on the color to select it.
After color extraction is completed, start the following steps:click the Extract Color Gamut button → remove noise → spatial domain repair → color restoration.(Image after operation)

Set the threshold, then click Particle Analysis.
The data will be displayed in the text box on the left.

Print Report
After the analysis is complete, click the Print Report button and enter thecorrespondingdata.

九、Workplace Air - Determination of Dust - Part 5: Concentration of Asbestos Fibers …… GBZ/T 192.5-2007
According to the search parameters, the software finds the particles that meet the requirements and calculates the perimeter, area,major diameter, minor diameter, and aspect ratio of each particle. It also counts the number of particles and the percentage of particles in each major and minor diameter interval.Particles can be added or deleted manually.

(Module Interface)

(Search Parameters)

(Field of View Data)

(Final Statistical Data)
Shandong Laishi Automation Technology Co., Ltd. (hereinafter referred to as "Laishi") is composed of a technical team with more than 10 years of research and development and manufacturing experience. The registered capital of the company is 3 million yuan. We specialize in the research and development, production, and sales of various desktop hardness testers and metallographic sampling equipment, and provide professional research and sales services for physical and chemical testing instruments, laboratory equipment, analytical equipment, and automation equipment.
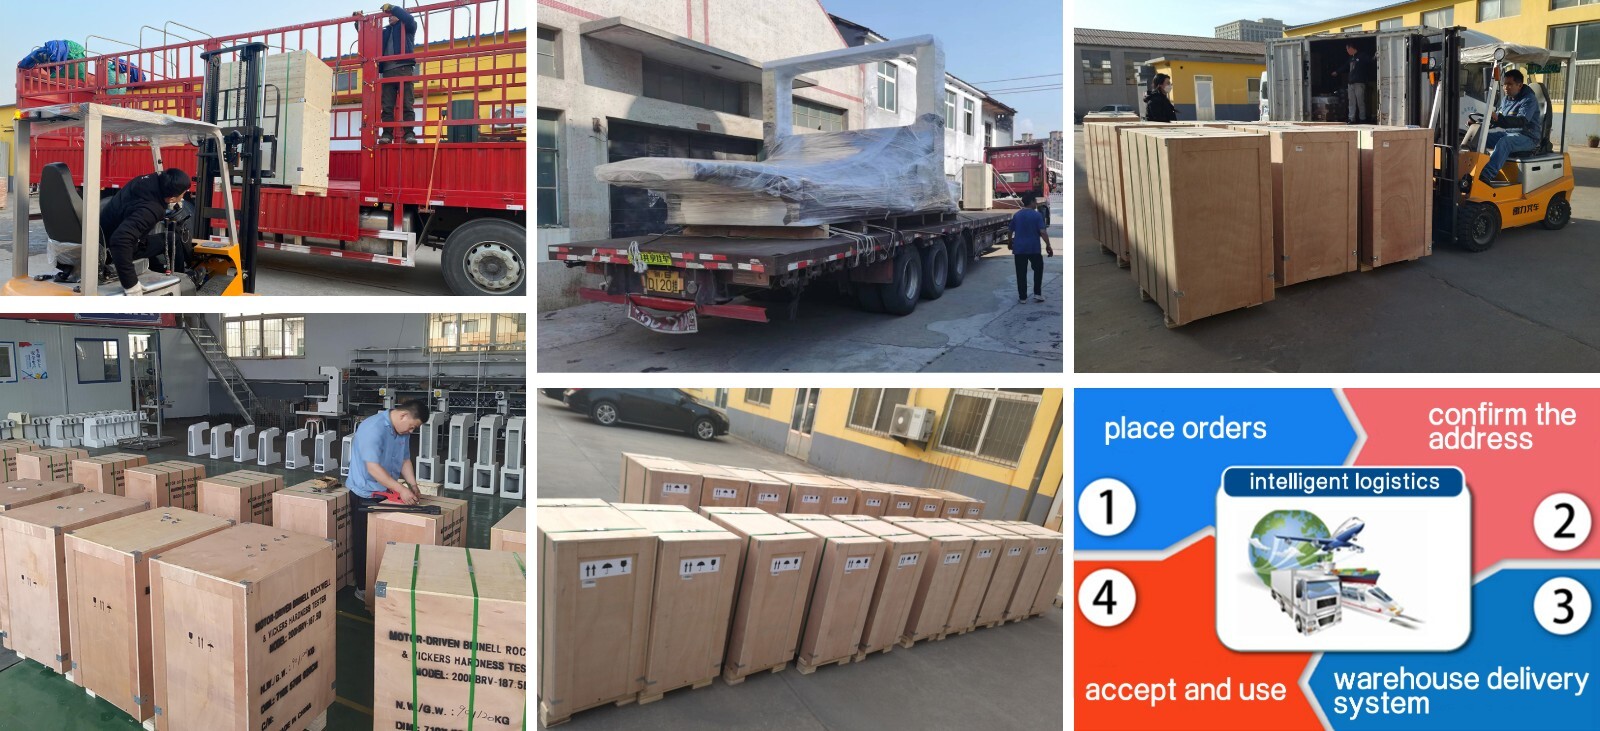
Packaging and Shipping
Have an inquiry or some feedbak for us? Fill out the form below to contact our team.
Related Product Recommendations
 Introduction to the Fiber Software SystemMore Details +
 Microscopy Software") Rock (Polarizing) Microscopy SoftwareMore Details +
Rock (Polarizing) Microscopy SoftwareMore Details + Porosity Image Analysis SystemMore Details +
 Introduction to Particle Size Image Analysis SoftwareMore Details +
 Introduction to Cleanliness Image Analysis SoftwareMore Details +
 Genuine FMIA2025 Metallographic Image Analysis SoftwareMore Details +
 FHF2024 Weld Penetration Measurement SoftwareMore Details +
 FEG Series Digital Microscope CameraMore Details +
 FCL-RS Metallographic Image Measurement SoftwareMore Details +
 Carbon Black Microscopic Dispersion Measurement Software 2024More Details +
 Microscopy Software")


Search Starts Here
Our Email